
- Understanding Crypto Market Cycles
- The Bitcoin Halving Connection
- Current Market Phase and Accumulation Signals
- Key Indicators That Signal a Bull Run Is Starting
- What Actually Triggers a Crypto Bull Run
- Altcoin Season and Market Rotation Patterns
- Common Mistakes When Timing Crypto Markets
- Historical Bitcoin Bull Runs: Halving to Peak Timeline
Bitcoin’s price doesn’t move randomly. Anyone tracking cryptocurrency since 2011 notices the same rhythm repeating—brutal crashes followed by explosive rallies that mint new millionaires while skeptics watch from the sidelines. Right now, in early 2026, we’re somewhere in that cycle. The real question: are we still early, or has the best part already passed?
Understanding Crypto Market Cycles
Since Bitcoin’s first major rally in 2011, cryptocurrency markets have pulsed through repeating seasons with surprising regularity. This isn’t random. Bitcoin’s code literally programs these rhythms into existence.
Markets cycle through four seasons. First comes accumulation—prices go sideways, most people lose interest, and wallet addresses that haven’t moved in years suddenly start buying again. You won’t see headlines. Your coworker who wouldn’t shut up about crypto in 2021? They’ve moved on to talking about AI stocks or real estate.
Then the markup phase begins. Prices creep higher. A 10% gain becomes 20%, then 50%. Bitcoin usually breaks out first. Ethereum and other established projects follow weeks or months later. Eventually, everything pumps—even the questionable projects with no actual product.
Distribution happens when early buyers sell to newcomers. Your Uber driver mentions they just bought their first Bitcoin. Your aunt asks about Dogecoin at Thanksgiving. Trading volume explodes, but price momentum starts sputtering. The markdown phase follows—everything crashes 70-90%, resetting the entire pattern.
The four year crypto cycle emerged because Bitcoin’s mining rewards drop in half roughly every four years. Every cycle since 2011 has tracked this schedule. Bitcoin hit $1,100 in the 2013 peak. The 2017 top touched $19,800. By 2021, prices reached $69,000.
Here’s what crypto cycle theory tells us: percentage gains shrink as markets mature. Bitcoin won’t do another 10,000% run from current levels—there isn’t enough money on Earth. But here’s the twist: a 300% gain from $60,000 puts $120,000 in your pocket per coin. A 10,000% gain from $100 only gives you $10,000. Smaller percentages, bigger absolute numbers.
The Bitcoin Halving Connection
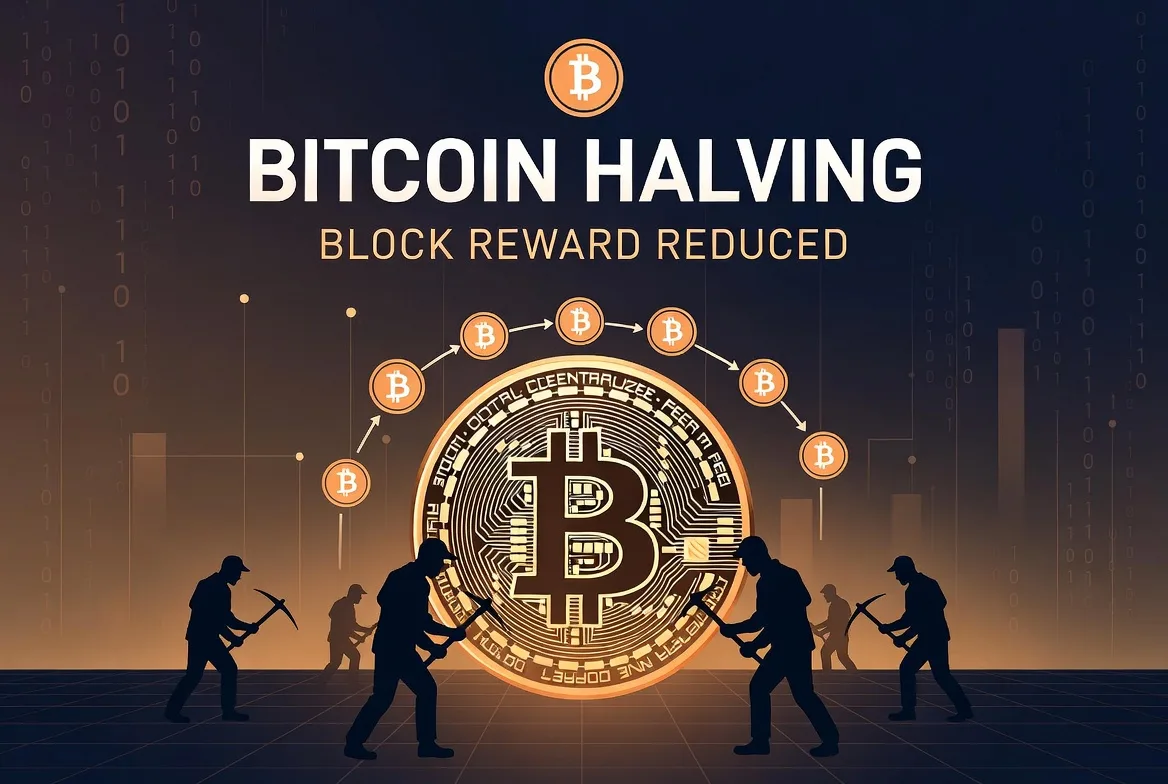
Every 210,000 blocks—roughly four years—Bitcoin’s protocol cuts mining rewards in half. This isn’t a prediction or a hope. It’s code executing automatically.
The economics are straightforward. Miners currently receive 3.125 BTC for each block they mine. Before April 2024, they got 6.25 BTC. That’s half as many new bitcoins entering circulation every day. If buyers want the same amount of Bitcoin but only half as much new supply exists, prices have to rise. Supply and demand, taught in every Economics 101 class.
Let’s trace the pattern. In 2012, rewards dropped from 50 to 25 BTC per block. Bitcoin peaked about a year later. The 2016 halving slashed rewards to 12.5 BTC. Prices topped in December 2017, roughly 17 months later. May 2020’s halving brought rewards down to 6.25 BTC—the market peaked in November 2021, 18 months after.
April 2024 brought the latest halving. Rewards now sit at 3.125 BTC per block. Following historical patterns, we might see the peak anywhere from late 2025 through late 2026. Maybe sooner. Maybe later. Unlike the halving itself, peak timing isn’t written in code.
The bitcoin halving and bull market relationship isn’t guaranteed by physics. Each cycle happens inside a unique economic environment. The 2020-2021 rally coincided with governments printing trillions in COVID stimulus. The current cycle started with interest rates at 5.5%, then shifted as the Fed cut rates through 2024-2025. Different conditions, potentially different outcomes.
But here’s what compounds: by 2026, Bitcoin’s annual inflation rate drops below 1%. Gold’s inflation rate? About 1.5-2% annually. Bitcoin becomes provably scarcer than the metal humans have valued for 5,000 years. That matters, regardless of whether prices peak in October 2025 or March 2026.
Current Market Phase and Accumulation Signals
Multiple data points in early 2026 suggest we’ve left the bear market behind and entered the early markup phase. Bitcoin hasn’t made new all-time highs yet, but the bottom from 2022 looks firmly established.
The crypto accumulation phase shows specific fingerprints. Long-term holder wallets grow while speculator wallets shrink. Exchange balances decline—coins move into cold storage where they can’t be sold immediately. Throughout 2025, exchange reserves dropped to multi-year lows. MtGox trustee distributions added supply, yet exchange balances still fell. Someone’s buying and holding.
Realized price—the average purchase price of all existing Bitcoin—crossed above market price for months in 2024 and early 2025. This happened before previous bull runs. When the “average Bitcoin” sits underwater, weak hands capitulate. When it goes back into profit, holders tend to hold.
Addresses that haven’t moved Bitcoin in 12+ months now control roughly 70% of supply. Only twice before has this metric reached this level: before the 2017 bull run and before the 2021 bull run. Third time’s the charm?
Miner capitulation ended by early 2025. After the April 2024 halving, mining profitability tanked. Inefficient miners went bankrupt and sold their Bitcoin to pay debts. Hash rate—the total computing power securing the network—dropped briefly, then recovered and hit new all-time highs by late 2025. The weak miners are gone. The survivors are printing money again and holding.
Institutional accumulation continues quietly. Bitcoin ETFs launched in January 2024. Despite volatility, these products showed consistent net inflows throughout 2025. Corporations kept adding Bitcoin to treasury reserves. These aren’t traders trying to flip for 20% gains. They’re buyers who plan to hold for years.
Meanwhile, retail investors? Still sitting this one out. Google Trends data for “Bitcoin” remains well below 2021 peaks. Reddit’s cryptocurrency forums show moderate activity, nothing like the mania of previous tops. When retail stays home, smart money accumulates. When your barber starts giving investment advice, it’s time to sell.
Key Indicators That Signal a Bull Run Is Starting
No single metric tells you “the bull run starts now.” But when multiple signals align, probability shifts in your favor.
Price action matters most because it reflects everything—all buyers, all sellers, all opinions about the future condensed into one number. Bitcoin decisively breaking above $69,000 (the 2021 high) would confirm new bull market territory. We haven’t seen that sustained break yet in early 2026, though we’ve tested those levels multiple times.
Volume tells you what price can’t. Are buyers enthusiastic or hesitant? Bull runs feature heavy volume on up-days and light volume on down-days. More buyers than sellers at progressively higher prices. Bear markets flip this—volume spikes on declines as people panic-sell, then dries up on bounces as nobody wants to buy.
Institutional flows provide a window into “smart money” positioning. OTC desk activity, ETF creation patterns, CME futures open interest—these metrics show where professional capital is moving. Throughout 2025, we’ve seen steady institutional accumulation. Not the frenzy of late 2021, but consistent buying that suggests informed players are building positions.
Sentiment indicators measure market psychology. The Crypto Fear & Greed Index, perpetual futures funding rates, options markets skew toward puts or calls. Bull runs typically start when fear dominates and everyone swears they’ll never touch crypto again. By early 2026, we’ve moved from extreme fear into neutral territory. Not euphoric yet, which might mean we’re early.
The 200-week moving average has caught Bitcoin’s price every bear market since 2011. Spending months below this level? Accumulation zone. Trading decisively above it? Bull market confirmed. We’ve been above it since mid-2024, another check in the bull case column.
Network activity shows real usage beyond speculation. Active addresses, transaction volume, DeFi protocols processing billions in value—these metrics lag price initially but confirm genuine adoption. By 2025, Ethereum Layer-2 networks process millions of transactions daily. Bitcoin’s Lightning Network handles small payments globally. Usage drives long-term value.
What Actually Triggers a Crypto Bull Run
Bull runs don’t start because someone flips a switch. They emerge when multiple catalysts converge, shifting the supply-demand equation.
Monetary policy sets the foundation. Bitcoin and risk assets generally move opposite to interest rates. When the Federal Reserve cut rates from 5.5% to 4.0% through late 2024 and 2025, liquidity increased. Lower rates mean the “cost” of holding assets that don’t pay interest (like Bitcoin) decreases. More money chases the same number of Bitcoin.
Institutional adoption changed the game permanently. Before 2024, financial advisors couldn’t recommend Bitcoin to clients even if they wanted to—no regulated products existed. The January 2024 ETF approvals solved this. By 2026, these products hold hundreds of billions in assets. Pension funds, endowments, family offices—they move slowly, but they move size. And once they buy, they rarely sell.
Regulatory clarity removed a major risk. The 2025 U.S. regulatory framework defined rules for token classifications, exchange licensing, and custody standards. Not perfect, but clear enough that JPMorgan and Goldman Sachs could build crypto divisions without fearing the SEC would shut them down in six months. Europe and Asia followed with similar frameworks. Global capital flows more easily when rules are clear.
Technology improvements drive fundamental value. Ethereum’s Layer-2 solutions reduced transaction costs by over 90% compared to 2021. Bitcoin’s Lightning Network reached critical mass—you can actually buy coffee with Bitcoin now, instantly and cheaply. These aren’t just technical achievements; they expand the addressable market beyond pure speculation.
Market psychology amplifies everything. Prices rise, media coverage increases, new people hear about crypto, they buy, prices rise more. This feedback loop drives parabolic moves during late-stage bull runs. It breaks when new money inflows can’t sustain appreciation rates—usually after everyone who wants to buy has already bought.
Global instability paradoxically helps Bitcoin. Currency devaluation in Turkey, banking crises in regional U.S. banks during 2023, geopolitical tensions—these remind people why decentralized money matters. Bitcoin isn’t just a speculation vehicle; it’s a hedge against traditional system failures.
Altcoin Season and Market Rotation Patterns
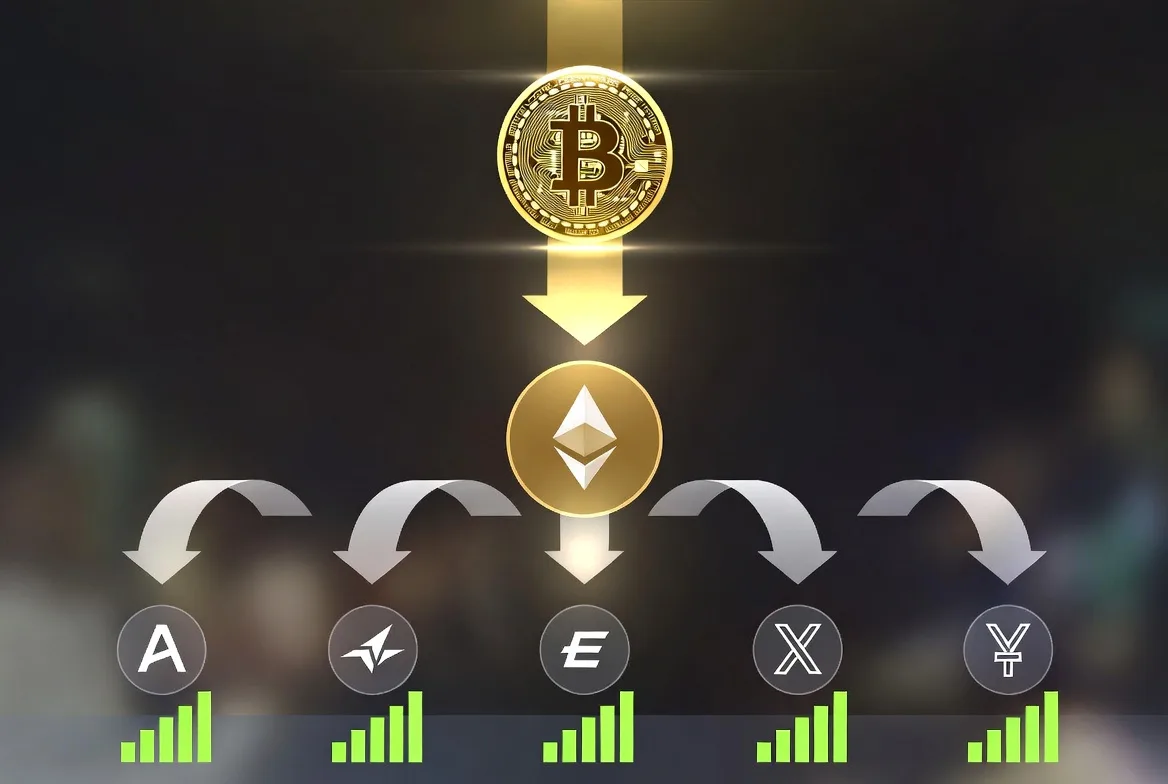
Money doesn’t flow into all cryptocurrencies simultaneously. It rotates in a predictable sequence that creates opportunities—and traps.
Bitcoin typically moves first. It has the deepest liquidity, most institutional acceptance, and longest track record. Prices break out, media notices, new capital enters. Then investors think: “Bitcoin’s up 50%… what else could do 100%?”
That’s when capital rotates into major altcoins. Ethereum, Solana, and top-10 projects by market cap attract the next wave. They offer established ecosystems and real usage, but smaller market caps than Bitcoin. A billion dollars entering Ethereum makes a bigger percentage impact than the same billion entering Bitcoin.
Finally comes altcoin season during bull run—when smaller projects explode. Why? Psychology and math. If you have $10,000 and Bitcoin doubles, you make $10,000. If a $50 million market cap project doubles, you make the same percentage. But that smaller project “feels” like it has more room to run. This psychology pushes capital into increasingly risky assets.
Bitcoin dominance—Bitcoin’s percentage of total crypto market cap—telegraphs these rotations. When dominance rises, Bitcoin outperforms everything. When it falls, altcoins are rallying harder. In early 2021, Bitcoin dominance sat around 70%. By year-end, it had dropped to 40% as altcoins exploded. Ethereum gained over 400%. Smaller projects went 10x, 20x, even 100x.
Here’s the catch: most altcoin gains evaporate. In the 2022 bear market, Bitcoin fell roughly 75% from its peak. Most altcoins fell 85-95%. Many never recovered. The 100x memecoin that made people paper millionaires? Now down 99% with zero liquidity to actually sell.
Risk management separates winners from cautionary tales. Large-cap altcoins like Ethereum carry less risk than micro-caps. They won’t do 100x, but they probably won’t go to zero either. A balanced portfolio might hold 60-70% Bitcoin, 20-30% established alts, and 10% high-risk moonshots. This captures upside while protecting capital.
Sector rotation happens within altcoins too. DeFi tokens rally, then Layer-1 competitors, then gaming projects, then memecoins. These rotations happen fast—a sector might pump 200% in two weeks, then give it all back. Chasing these moves usually means buying tops and selling bottoms. Most investors do better picking quality projects and holding through volatility.
Common Mistakes When Timing Crypto Markets
You can’t time markets perfectly. But you can avoid the mistakes that guarantee losses.
Waiting for the “perfect” entry means never entering. Bitcoin could pull back to $55,000… or it could run to $100,000 first. Investors who waited for $10,000 Bitcoin in 2023 missed the entire recovery. Dollar-cost averaging beats timing—buying $500 monthly throughout 2023 would have captured the range beautifully. Trying to catch the exact bottom typically means sitting in cash during rallies.
FOMO destroys more capital than crashes. Retail investors Google “how to buy Bitcoin” when prices are making headlines and hitting all-time highs. They buy from early investors taking profits. Then prices correct 30%, they panic and sell at a loss, swearing off crypto forever. Search interest for “Bitcoin” peaked in November 2021—the exact month of the $69,000 top. Not a coincidence.
Ignoring crypto market peak indicators turns profits into losses. You rode Bitcoin from $20,000 to $69,000—congratulations, you’re up 245%! But you never sold, and now it’s back to $30,000. You’re only up 50%. The cycle gave you a 245% gain and you returned most of it. Euphoric sentiment, extreme funding rates, your relatives asking for investment advice, parabolic price charts—these signal late-stage bull markets. Have an exit plan before greed takes over.
Leverage amplifies losses catastrophically. A 10x leveraged position gets liquidated with a 10% move against you. Bitcoin regularly moves 10% in a day. The 2021-2022 period saw over $10 billion in liquidations. Leverage works until it doesn’t. In crypto, it eventually doesn’t work, usually at the worst possible time.
Chasing altcoin lottery tickets rarely works. Yes, some altcoin went 1,000x last cycle. Do you know which one will do it this cycle? Neither does anyone else. The 2018 bear market killed 95%+ of altcoins permanently. Even in the 2021 bull run, most altcoins peaked months before Bitcoin, then collapsed while Bitcoin made new highs. A Bitcoin-heavy portfolio with selective altcoin exposure beats trying to pick the next 1,000x winner.
Selling everything too early also hurts. Taking profits makes sense—selling 20% when you’re up 100% locks in gains and reduces stress. But exiting completely at the first sign of profit means missing potential upside. Systematic profit-taking (sell 10-20% at predetermined levels) balances risk management with continued exposure.
Historical Bitcoin Bull Runs: Halving to Peak Timeline
| Halving Date | Bull Run Peak Date | Months from Halving to Peak | Bitcoin Price at Halving | Bitcoin Peak Price | Percentage Gain |
|---|---|---|---|---|---|
| November 2012 | November 2013 | 12 months | $12 | $1,100 | 9,067% |
| July 2016 | December 2017 | 17 months | $650 | $19,800 | 2,946% |
| May 2020 | November 2021 | 18 months | $8,600 | $69,000 | 702% |
| April 2024 | TBD (estimated Q3-Q4 2026) | ~24-30 months (projected) | $63,000 | TBD | TBD |
Each cycle following a halving event has produced significant bull runs, though returns diminish as market capitalization expands. The timeline from halving to peak also appears to lengthen with market maturation.
The four-year cycle is lengthening as Bitcoin matures. Institutional capital moves slower than retail, creating extended accumulation and distribution phases. We’re likely looking at 24-30 month halving-to-peak timelines now, compared to 12-18 months in earlier cycles. The pattern persists but evolves.
Willy Woo
Woo’s analysis focuses on blockchain data and has successfully identified several major market turning points using supply dynamics and on-chain metrics.
This evolution means patience matters more than ever. The 2013 cycle that peaked just 12 months after halving operated in a completely different environment—no institutions, no regulations, pure retail speculation. Today’s market involves allocation committees, compliance departments, and risk frameworks that extend decision-making timelines from days to months.
FAQs
Bull runs from initial breakout to final peak usually span 12-24 months. But measuring from bear market bottom to bull market top extends the timeline to 24-36 months. The 2020-2021 cycle bottomed in March 2020 and peaked in November 2021—20 months total. The sharpest gains tend to compress into the final 6-9 months, which creates a dilemma: waiting for confirmation often means missing the best part. Bitcoin jumped from $30,000 to $69,000 in just six months during late 2021.
No, and anyone claiming otherwise is selling something. Bull runs don’t start on specific dates—they emerge gradually as multiple factors align. Looking backward, the 2020 bull run “started” in March 2020 (the bottom), or July 2020 (breaking $10,000), or January 2021 (exceeding the previous $20,000 high), depending on your definition. What matters more: positioning yourself during accumulation periods rather than trying to time exact inflection points. You’ll never catch the absolute bottom. You don’t need to.
Bitcoin should anchor any crypto portfolio, particularly if you value sleeping at night. It offers the deepest liquidity, widest institutional acceptance, and longest survival record. Altcoins can supplement for investors comfortable with higher risk. Consider allocating 60-70% to Bitcoin, 20-30% to established large-cap alternatives like Ethereum, and 10% or less to higher-risk smaller projects. This structure provides exposure to potential altcoin explosions while protecting against total wipeouts.
Several signals typically converge at tops. Mainstream media coverage reaches saturation—TIME magazine covers, CNBC discussions, billboards advertising exchanges. Google search interest for crypto terms spikes to peaks. Perpetual futures funding rates stay extremely positive for weeks, meaning traders are paying premium after premium to stay long. Celebrities and influencers endorse projects they clearly don’t understand. Your barber mentions their new altcoin investment. Parabolic price charts that can’t possibly sustain. When all these align, you’re probably near the top.
The four-year cycle exists because Bitcoin’s code programs halving events approximately every four years (specifically, every 210,000 blocks). Each halving cuts new Bitcoin supply by 50%, creating supply shocks. With steady or increasing demand but suddenly half the new supply, prices historically rise 6-18 months later. This pattern has repeated three complete times with remarkable consistency, though returns diminish as the market grows larger.
The cycle remains relevant but it’s evolving. Institutional participation, regulatory changes, and macroeconomic conditions now influence markets more than in early cycles dominated by retail speculation. The fundamental pattern—halving creates supply shock, supply shock drives bull run—still applies. However, timelines might extend and volatility could decrease as markets mature. Think of the four-year cycle as a probabilistic framework that should inform your thinking, not a guaranteed roadmap that dictates exact buy and sell dates. Markets don’t follow scripts perfectly, but they do tend to rhyme.
The next crypto bull run follows a playbook written over 15 years and four complete cycles. Exact timing remains uncertain—markets don’t follow scripts—but the framework is established: halvings reduce supply, institutional adoption provides sustained demand, and market psychology amplifies moves in both directions.
Multiple indicators in early 2026 suggest we’re somewhere in the early-to-mid markup phase following April 2024’s halving. Based on historical patterns, prices could peak anywhere from late 2025 through mid-2026, though macroeconomic factors, regulatory changes, or black swan events could shift this timeline significantly.
Profiting from crypto markets doesn’t require perfect timing. It requires understanding cycles, managing risk appropriately, and maintaining discipline when fear and greed pull in opposite directions. Accumulate when prices bore you and headlines disappear. Take profits when your relatives ask for investment advice and prices move parabolic. Never invest capital you can’t afford to lose completely.
The next bull run will arrive. Whether you profit depends on preparation rather than prediction. Investors who build positions during quiet periods, ignore daily noise, and establish clear exit strategies typically capture the majority of gains. Those waiting for certainty or chasing vertical price moves usually buy tops and sell bottoms. The choice is entirely yours.