
- Understanding Crypto Market Cycles and Where We Are Now
- Key Indicators Shaping the Current Crypto Market
- Institutional Investment and Its Impact on Market Direction
- Crypto Market Sentiment Analysis and What It Reveals
- Global Adoption Trends Influencing Market Growth
- Common Mistakes When Analyzing Crypto Market Trends
Bitcoin’s been around for over a decade now, and the crypto space has come a long way from basement miners and Reddit speculation. Today’s market? It’s a different animal entirely. Pension funds are getting involved. Banks are offering custody. The old playbook doesn’t quite work anymore.
Here’s what makes this tricky: you’ve got hundreds of metrics to watch, from blockchain data most people don’t understand to institutional money flows that dwarf retail trading. Miss the right signals, and you’ll buy tops or panic-sell bottoms. Get them right, and you’ll position yourself ahead of major moves.
What follows is a practical breakdown of how to read crypto markets in 2026—which cycles matter, which data points actually work, and which mistakes will drain your portfolio before you realize what happened.
Understanding Crypto Market Cycles and Where We Are Now
Crypto moves in waves. Always has. Four distinct phases repeat over and over, though never with identical timing: accumulation, markup, distribution, and markdown.
Accumulation happens after a brutal selloff. Prices flatline. Nobody’s talking about crypto at parties anymore. Volume dries up. This is when experienced players—institutions, veteran traders, people who’ve survived multiple cycles—start building positions while everyone else is licking their wounds. You’ll see this phase drag on for 12-18 months sometimes, testing the patience of anyone who’s left.
Then comes markup. Prices climb. Volume picks up. Bloomberg starts running crypto segments again. Your uncle asks about Bitcoin at Thanksgiving. The gains in this phase often outpace everything else in the cycle, and you’ll typically see Bitcoin lead the charge before money starts flowing into Ethereum and smaller altcoins. This rotation pattern has held across multiple cycles.
When early investors start selling to new buyers, you’ve hit distribution. Prices might still push higher, creating new all-time highs, but momentum weakens. Volatility spikes as bulls and bears fight it out. The tricky part? Retail investors usually pile in during this phase, buying the headlines while smart money is heading for the exits. Watch for rallies on declining volume and selloffs on heavy volume—classic warning signs.
Markdown completes the circle with sustained declines. Bad news dominates Twitter. Projects you thought were solid start failing. Leverage gets wiped out. Weak hands capitulate. This shakeout clears the speculative excess and sets up the next accumulation phase, usually lasting 9-15 months.

Where are we now? Most analysts peg us somewhere in mid-to-late markup. Bitcoin’s April 2024 halving set the stage—historically, the 18-24 month window after a halving brings substantial gains. We’re firmly in that window now. But this cycle’s got some unique twists: way more institutional money, clearer regulations than before, and different macro conditions than 2017 or 2021.
Let’s compare. The 2016-2017 run took Bitcoin up roughly 20x from halving to peak. The 2020-2021 cycle delivered more modest 8x gains, partly because Bitcoin’s market cap had grown so large. This time around? The trajectory suggests even more measured growth. Institutions might extend the markup phase longer than previous cycles, but they’ll probably cap the explosive percentage gains we saw in earlier eras.
Market cycles in crypto are driven by a combination of technical fundamentals, investor psychology, and macro liquidity conditions. The most successful analysts don’t rely on a single metric but rather build a mosaic of indicators that, when combined, reveal the market’s underlying health and likely direction.
Philip Swift
Key Indicators Shaping the Current Crypto Market
Price action alone won’t cut it. You need multiple data streams—blockchain metrics, market structure, cross-asset correlations—to build real conviction about where things are headed.
On-Chain Signals Every Investor Should Monitor
On-chain data gives you transparency that traditional markets can’t match. Everything’s recorded on the blockchain. You can see what’s actually happening, not just what exchanges report.
Active addresses tell you how many unique users are actually using the network. When this number climbs consistently, it typically signals growing adoption and engagement—real usage, not just speculation. Exchange netflows show whether holders are sending coins to exchanges (potentially to sell) or withdrawing to personal wallets (suggesting they plan to hold long-term).
Here’s one that matters: the MVRV ratio, which compares current market cap to the aggregate price everyone paid for their coins. Historically, MVRV above 3.5 has marked overheated territory where corrections follow. Below 1.0? That’s when markets look genuinely cheap. Right now, Bitcoin’s sitting around 2.3—room to run, but we’re not in “screamingly cheap” territory anymore.
Hash rate measures how much computational power miners are dedicating to the network. When hash rate climbs even as prices bounce around, miners are betting on future profitability. That’s bullish for the long term. A declining hash rate, though? That often precedes capitulation events where miners shut down unprofitable operations.
The spent output profit ratio (SOPR) tracks whether coins being moved are in profit or loss. Above 1.0 means people are selling at gains; below 1.0 means they’re taking losses. During healthy bull markets, you’ll see sustained SOPR above 1.0. During bear markets, readings below 1.0 signal capitulation—often the final washout before recovery begins.
Market Cap Distribution and Dominance Trends
Bitcoin dominance—its percentage of total crypto market cap—works as a useful cycle indicator. During bear markets, dominance typically rises as money flees risky altcoins for Bitcoin’s relative safety. Bull markets often see the opposite: dominance falls as investors chase higher returns in smaller assets.
Currently, Bitcoin dominance hovers around 52%. That’s down from 58% in late 2024 but well above the 40% lows we saw during peak altcoin seasons. This middle ground suggests we’re transitioning—Bitcoin still leads, but altcoins are starting to attract attention and capital.
Ethereum’s slice of the pie matters too. Since most DeFi protocols and NFT platforms run on Ethereum, its dominance reflects appetite for smart contract platforms and decentralized applications. When both Bitcoin and Ethereum dominance rise together, broader altcoin rallies usually follow within weeks or months.
| Indicator Name | What It Measures | Bullish Signal | Bearish Signal | Best Used For |
|---|---|---|---|---|
| MVRV Ratio | Current price vs. average holder cost | Drops below 1.0 (deeply undervalued) | Climbs above 3.5 (significantly overvalued) | Spotting major market tops and bottoms |
| Exchange Netflow | Coins moving between exchanges and wallets | Heavy outflows (accumulation behavior) | Heavy inflows (potential selling pressure) | Understanding holder conviction levels |
| Active Addresses | Daily network participation | Consistent upward trend | Declining participation | Measuring fundamental adoption strength |
| Hash Rate | Mining power and network security | Rising despite price volatility | Sharp sustained decline | Confirming long-term trend direction |
| SOPR | Whether moved coins are profitable | Stays above 1.0 in uptrends | Drops below 1.0 in downtrends | Finding capitulation moments and euphoria |
Institutional Investment and Its Impact on Market Direction
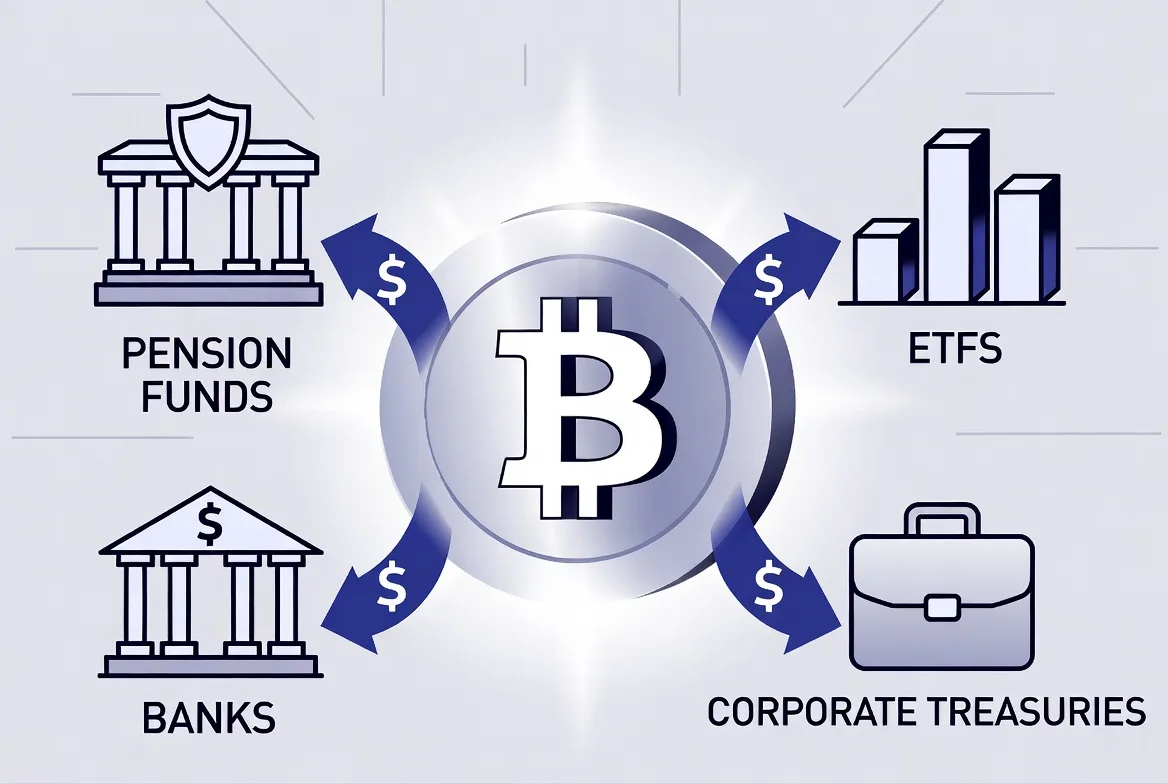
Wall Street’s arrival changed everything. Pension funds, university endowments, corporations—they’re all allocating to crypto now. This brings stability, but it also ties crypto markets to traditional finance in ways that didn’t exist before.
The January 2024 approval of spot Bitcoin ETFs was a watershed moment. Fast forward to Q1 2026, and these ETFs hold over $85 billion in assets. Weekly inflows during positive market conditions average $300-500 million. That’s consistent institutional demand creating a price floor we never had in earlier cycles.
Corporate treasuries keep expanding their Bitcoin holdings beyond the early movers like MicroStrategy and Tesla. Mid-sized companies increasingly view Bitcoin as inflation protection—a treasury reserve asset that might hold value better than cash. This trend accelerated after 2025’s accounting rule changes, which finally let companies mark Bitcoin holdings to market value instead of only recording losses.
Traditional banks now offer the full suite: custody, trading, lending. JPMorgan, Goldman Sachs, BNY Mellon—institutions that once dismissed crypto now provide infrastructure for it. This removes major barriers for traditional investors who worried about security and compliance.
Regulatory clarity matters enormously here. The U.S. framework clarified in late 2024 finally distinguished securities from commodities more clearly, cutting through years of legal uncertainty. Europe’s MiCA regulations did something similar. Both developments encouraged institutional entry.
| Year | Event/Development | Impact on Market | Market Cap Change |
|---|---|---|---|
| 2024 | U.S. spot Bitcoin ETF approval | Opened floodgates for institutional access | +$650B (January-December) |
| 2024 | Ethereum ETF launch | Legitimized smart contract platforms | +$180B (July-December) |
| 2025 | New accounting rules allow fair value | Drove corporate treasury adoption | +$220B (full year) |
| 2025 | Major banks launch full custody offerings | Removed institutional infrastructure barriers | +$145B (full year) |
| 2026 | First major pension fund allocates 5% | Signaled mainstream acceptance | +$95B (Q1 only) |
The institutional impact goes beyond just money flowing in. Professional investors bring risk management that reduces wild volatility. But there’s a tradeoff: Bitcoin now correlates more closely with tech stocks, especially during market stress. When the Fed talks about rate hikes or liquidity concerns hit markets, Bitcoin moves with the Nasdaq in ways it didn’t back in 2017.
Crypto Market Sentiment Analysis and What It Reveals
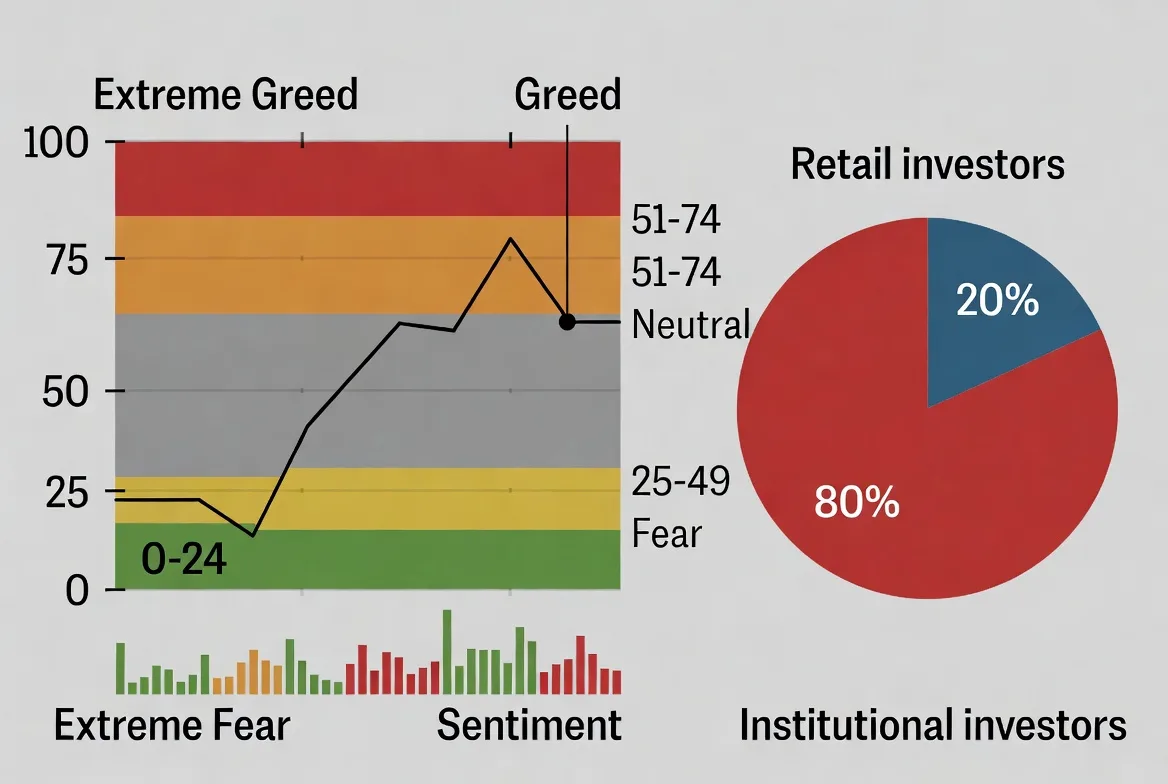
Sentiment measures the crowd’s emotional state—and the crowd is usually wrong at extremes. Peak pessimism often marks bottoms; peak optimism often signals tops.
The Crypto Fear & Greed Index pulls together multiple data sources—volatility readings, market momentum, social media activity, surveys, and Bitcoin’s market share—and spits out a single number from 0 to 100. Extreme fear (below 20) has repeatedly marked fantastic buying opportunities. Extreme greed (above 80) has preceded painful corrections. Throughout late 2024 and early 2025, the index mostly bounced between 55-75, suggesting cautious optimism rather than the euphoria that marks cycle tops.
Social sentiment tools scan Twitter, Reddit, Telegram, and other platforms for mentions, tone, and engagement. Rising positive buzz can precede price moves, though this generates plenty of false signals. What’s more useful: watching the ratio of newcomers to veterans. When social channels flood with beginners asking basic questions, distribution phases typically follow within weeks or months.
Retail and institutional sentiment often diverge, and that’s where opportunities hide. Retail tends toward momentum chasing and emotional reactions. Institutions take longer-term positions based on fundamental analysis. When retail turns extremely negative while institutional money keeps flowing in, strong buying opportunities usually emerge.
Funding rates on perpetual futures reveal leverage and positioning. Positive funding means longs are paying shorts, indicating bullish leverage. Extremely high funding rates—above 0.1% every 8 hours—often precede sharp liquidation events as overleveraged positions get wiped out. Negative funding suggests bearish positioning and can mark local bottoms where shorts get squeezed.
Options markets provide sophisticated sentiment reads. Put/call ratios, implied volatility skew, and open interest distribution show how professional traders position for future moves. Heavy put activity indicates hedging or bearish bets. Call-heavy positioning suggests bullish expectations. The smart money’s options positioning has predicted major moves more reliably than retail sentiment surveys.
Global Adoption Trends Influencing Market Growth
Long-term value depends on actual use beyond speculation. Payment integration, developing market adoption, and Web3 development all drive fundamental demand that outlasts hype cycles.
Payment integration leaped forward in 2025-2026. Major processors now handle crypto transactions seamlessly. Visa and Mastercard process over $12 billion in crypto-linked payments each quarter—that’s actual commerce, not just trading volume. Stablecoin usage for cross-border remittances surged 340% year-over-year, offering faster and cheaper alternatives than Western Union or traditional wire transfers.
Developing markets show the strongest adoption rates. In countries dealing with currency instability or limited banking infrastructure, cryptocurrencies provide financial services that didn’t exist before. Nigeria, India, and Brazil consistently rank among the highest adoption rates globally. People there use digital assets for savings, remittances, and everyday commerce. This grassroots adoption builds sustainable demand that persists regardless of speculative cycles.
Web3 development activity serves as a leading indicator. Developer commits to crypto repositories, new project launches, venture capital flowing into blockchain infrastructure—these signal where the ecosystem’s headed next. Despite bear markets and negative headlines, developer activity stayed robust through 2024-2025. That suggests continued innovation regardless of short-term price swings.
Regulatory clarity varies dramatically by region but trends positive overall. The U.S. framework from late 2024 provides workable guidelines, though some builders still prefer Switzerland, Singapore, or the UAE for friendlier treatment. Europe’s MiCA regulations are comprehensive but create compliance costs that favor established players over scrappy startups. Still, clear rules beat regulatory uncertainty any day.
Central bank digital currencies (CBDCs) represent both competition and validation. Over 90 countries are exploring or piloting CBDCs now, with China’s digital yuan leading in actual deployment. While CBDCs might compete with cryptocurrencies for certain use cases, they validate blockchain technology and get populations comfortable with digital money concepts. That familiarity ultimately benefits the entire crypto ecosystem.
Common Mistakes When Analyzing Crypto Market Trends
Even experienced analysts make predictable errors. Recognizing these patterns helps you avoid blowing up your portfolio.
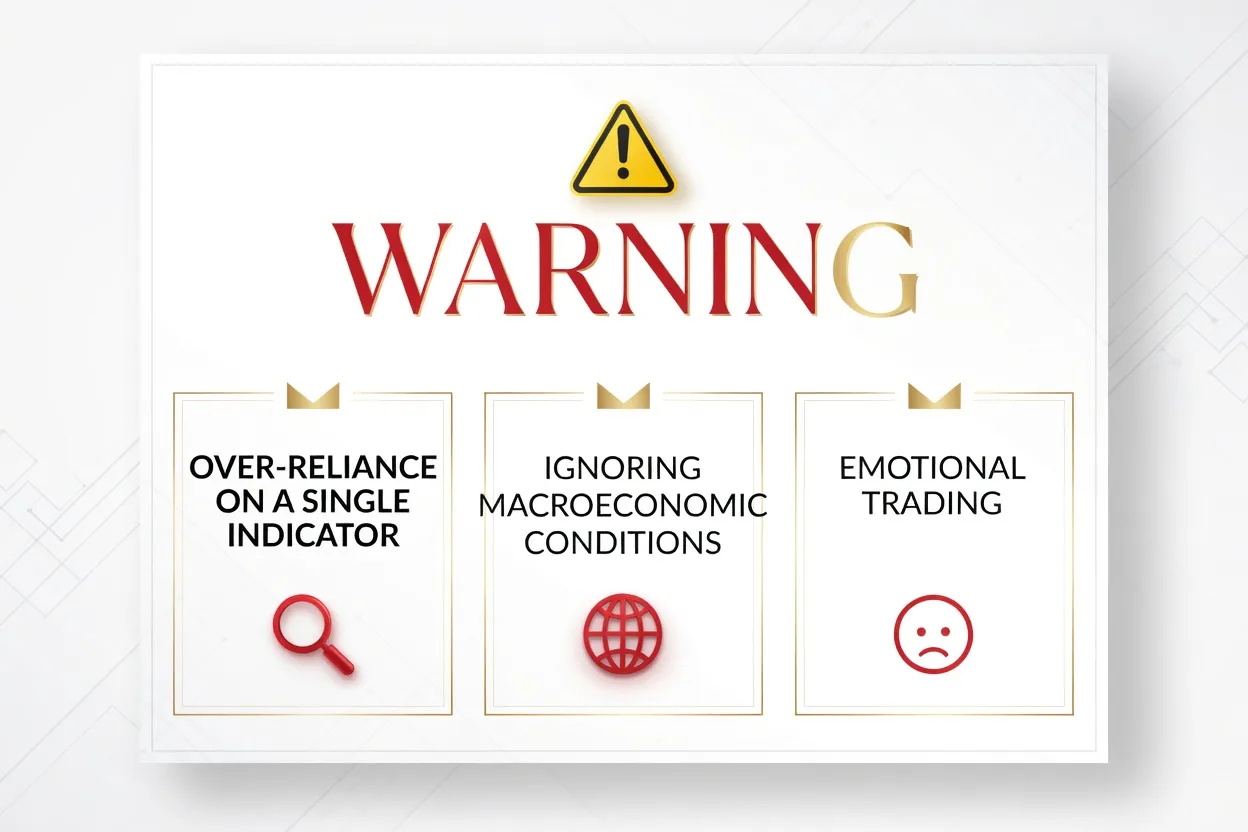
Betting everything on a single indicator creates false confidence that’ll cost you money. No metric perfectly predicts markets. The analyst who bought only based on low MVRV ratios in 2018 waited many painful months for the actual bottom. You need multiple uncorrelated indicators—blockchain metrics, sentiment data, macro conditions—working together. Any single measure in isolation will mislead you eventually.
Ignoring the macro environment has become increasingly dangerous as crypto matures. Bitcoin used to move independently of stocks and bonds. Not anymore. Now it correlates significantly with risk assets, especially tech stocks. Federal Reserve policy, inflation prints, global liquidity conditions—these impact crypto as much as on-chain metrics. The analyst who ignored rising interest rates in 2022 missed glaring warning signs of the coming downturn.
Emotional decisions destroy returns even when your analysis is correct. Fear during capitulation prevents buying at optimal prices. Greed during euphoria prevents taking profits at peaks. Successful investors establish rule-based systems and actually follow them regardless of emotions. Want a simple strategy that would have beaten most active traders? Buy when Fear & Greed drops below 25, sell when it exceeds 75. Boring, mechanical, profitable.
Misreading which cycle phase we’re in leads to catastrophically mistimed trades. The investor who thought we were in early accumulation in late 2021—because prices had corrected 30% from highs—failed to recognize we were actually entering markdown, with much further to fall. Understanding our current phase requires humility and willingness to update your views when new data contradicts your thesis.
Cherry-picking information that confirms what you already believe while dismissing contradictory evidence cripples analysis. The Bitcoin maximalist who refuses to acknowledge Ethereum’s growth and the altcoin enthusiast who dismisses Bitcoin’s network effects both suffer from this bias. Actively seek out disconfirming evidence. Steel-man the opposing viewpoint. Your analysis will improve dramatically.
Ignoring risk management eliminates even the best analysts. The trader who correctly called the 2021 bull market but used 10x leverage got liquidated during a temporary 15% correction, missing the subsequent 200% rally. Position sizing, stop losses, portfolio diversification—these matter as much as accurate market calls. More, actually, because you can survive being wrong if you manage risk properly.
FAQs
There’s no magic indicator that calls every move, but combining MVRV ratio, exchange netflows, and hash rate trends gives you a solid foundation for longer-term analysis. For shorter timeframes, funding rates and options market data reveal positioning and leverage that often precedes moves. The real key is using multiple indicators that don’t correlate with each other—if they all point the same direction, you can build conviction. And don’t forget macro conditions like interest rates, liquidity, and risk appetite, which have become increasingly important as institutions dominate trading volume.
Historical patterns from one Bitcoin halving to the next span roughly four years, but individual phases vary wildly. You might see 12-18 months of accumulation, then 12-24 months of markup, followed by 3-6 months of distribution, and 9-15 months of markdown. These are averages, not rules carved in stone. The current cycle shows signs of stretching longer due to institutional involvement and clearer regulatory frameworks. The markup phase might extend beyond historical patterns while limiting the extreme volatility peaks we saw in 2017 or 2021.
Institutional money has dramatically reduced volatility compared to earlier cycles, but it’s also connected crypto to traditional markets in new ways. Professional investors bring sophisticated risk management and longer time horizons, which creates price support during downturns. The downside? They transmit broader market stress into crypto during risk-off periods. You saw this when Bitcoin dropped alongside tech stocks during liquidity crunches in 2022 and 2023. Overall, institutions stabilize markets but reduce the explosive upside volatility that characterized Bitcoin’s early years.
Start simple: track Bitcoin dominance, the Fear & Greed Index, and exchange netflows. These three metrics are accessible to beginners but provide meaningful insights about market conditions. Follow reputable on-chain analytics firms like Glassnode or CoinMetrics for educational content that explains their methodologies without requiring a PhD. Paper trade your analysis for several months before committing real money—keep a journal of predictions and outcomes to identify where you succeed and fail. Resist the urge to track 50 metrics at once. Master a few core indicators first. Depth beats breadth when you’re learning.
On-chain signals come directly from blockchain data—transaction counts, active addresses, how holders behave with their coins. This information is transparent and verifiable, showing fundamental network activity and holder conviction. The limitation? On-chain data often lags price movements. Off-chain signals include exchange trading data, derivatives positioning, sentiment surveys, and macroeconomic indicators. These tend to lead price movements but can be manipulated or misinterpreted more easily. The strongest analysis combines both: use on-chain data for fundamental health assessment and off-chain signals for timing and sentiment context.
Reading crypto markets well means synthesizing diverse information—blockchain data, institutional flows, global adoption patterns, sentiment extremes, and macro conditions. The market has matured considerably since Bitcoin’s early days. Professional investors bring stability and infrastructure, but they’ve also reduced the wild 100x volatility of earlier cycles.
Looking ahead through 2026, the outlook remains constructive. Institutional adoption continues, regulatory frameworks keep clarifying, and real-world utility keeps expanding. But risks persist: macroeconomic headwinds, regulatory reversals in key markets, or major technical failures could derail positive momentum quickly.
Success depends on avoiding the analytical mistakes that trip up most people—relying on single indicators, ignoring macro conditions, letting emotions drive decisions, and neglecting risk management. Build a framework that combines blockchain fundamentals, sentiment indicators, and macroeconomic awareness. Most importantly, stay humble and adapt as markets evolve in ways that challenge even sophisticated models.
The investors who thrive don’t predict the future perfectly—nobody does. They build robust frameworks that adapt to changing conditions while managing risk effectively. Whether we’re entering the final stretch of this cycle’s markup phase or beginning an extended institutional-driven run, disciplined analysis and risk management remain constants. That’s what separates surviving traders from the ones who blow up and disappear.