
Bitcoin’s price doesn’t move randomly. Look at any long-term chart and you’ll spot a pattern—massive rallies, brutal crashes, then quiet periods before it happens again. Most crypto traders call this the four-year cycle, and there’s actual math behind it.
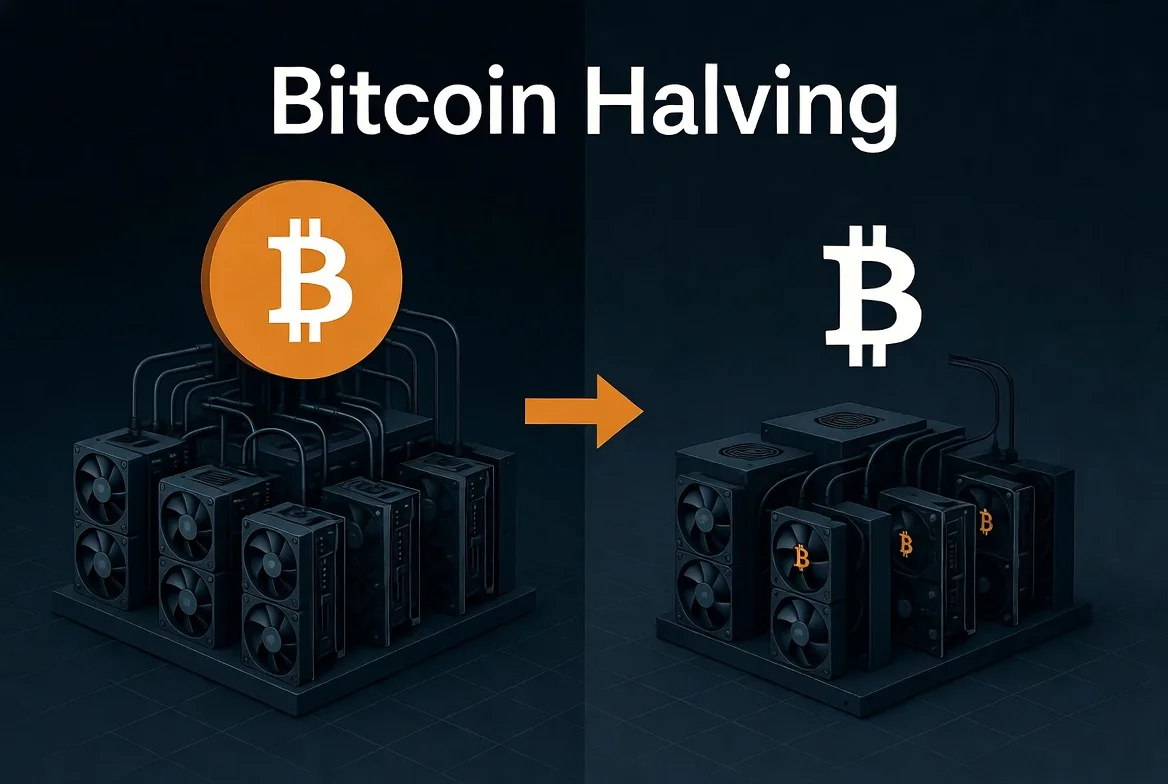
Here’s the thing: Bitcoin’s code cuts mining rewards in half every 210,000 blocks (about four years). Less new Bitcoin hitting the market means potential supply squeezes. We’ve watched this play out three times already, and the pattern holds up surprisingly well.
April 2024 brought the latest halving. Now in 2026, everyone’s debating whether history repeats itself or if something’s changed. Wall Street’s involved now. Regulations exist. Does that break the cycle, or just modify it?
Let’s dig into what actually drives these patterns and how to spot where we are in the current cycle.
What Is the Bitcoin Four Year Cycle
Bitcoin runs on a fixed schedule. Every 210,000 blocks—roughly 1,460 days—the network automatically slashes block rewards by half. First halving in 2012 dropped rewards from 50 to 25 BTC. Then 25 to 12.5 in 2016. Then 12.5 to 6.25 in 2020. April 2024 cut it to 3.125 BTC per block.
Why does this matter? Fewer coins entering circulation while demand stays constant (or grows) creates upward pressure. Economics 101.
Here’s what happened after each halving:
Post-2012: Bitcoin climbed from roughly $12 to north of $1,100 by late 2013. That’s over 90x.
Post-2016: Price went from around $650 to nearly $20,000 in December 2017. About 30x.
Post-2020: We saw $8,500 stretch to $69,000 by November 2021. Approximately 8x.
Notice something? Each cycle’s gains shrink. A $100 million market is easier to double than a $1 trillion market.
The cycle typically works like this: prices peak about 12-18 months after a halving. Then they crash 70-80%. A year-plus of sideways grinding follows. Another halving occurs. Then prices start climbing again.
Peak timing has been remarkably consistent. December 2013. December 2017. November 2021. All roughly 18 months post-halving. The pattern isn’t Swiss-watch precise, but it’s close enough to notice.
Market lows appeared in early 2015, throughout late 2018, and during late 2022—each time about a year after the previous peak.
How Halving Events Drive Market Cycles
Supply and demand isn’t complicated. Cut supply while demand holds steady? Price rises.
Before the 2024 halving, miners added about 900 fresh bitcoins daily to circulation. That dropped to roughly 450 after April. Every single day, half as much new Bitcoin exists to absorb buying pressure.
But here’s where it gets interesting: markets anticipate. Traders don’t wait for the halving—they position beforehand. That’s why you often see price action heating up 6-12 months ahead of the actual event.
The 2012 halving preceded gains exceeding 9,000%. Sounds insane now, but Bitcoin was trading for pocket change back then.
2016’s halving set up the 2017 bull run—about 3,000% gains from halving to peak.
2020 gave us roughly 700% appreciation by the 2021 top.
Each cycle delivers smaller percentage returns. Bitcoin’s market cap grows, requiring exponentially more capital for the same percentage moves. Turning $10 billion into $20 billion needs $10 billion inflow. Turning $1 trillion into $2 trillion needs $1 trillion inflow.
The mechanism makes sense: miners get half the rewards but face similar electricity and hardware costs. Some shut down operations, reducing sell pressure. Network difficulty adjusts downward, making mining profitable again for those who stayed. Meanwhile, media coverage around halvings draws attention, bringing new buyers.
Of course, this model isn’t perfect. The 2022 bear market hit hard partly because the Federal Reserve cranked interest rates up. Macro conditions matter. Regulatory crackdowns matter. Exchange collapses matter. Bitcoin doesn’t exist in a vacuum.
The Four Crypto Cycle Phases
Markets don’t just go up or down—they move through distinct stages with recognizable characteristics.
Accumulation Phase
This is where fortunes get built, but it feels terrible while it’s happening.
Prices have already crashed 75-85% from peak. Everyone who panicked has already sold. Trading volume? Dead. Your group chats? Silent. News headlines declaring Bitcoin’s demise for the hundredth time.
Smart money accumulates here. Not because they’re geniuses, but because they’re patient and contrarian. They buy when buying feels stupid.
This phase typically runs 12-18 months. Prices move sideways, sometimes drifting slightly upward. Volatility drops compared to the crash that preceded it. On-chain data shows Bitcoin moving from weak hands to strong hands—from people who capitulated to people planning to hold for years.
Remember 2022-2023? Bitcoin dropped from $69,000 to about $15,500 in November 2022, then spent months grinding between $16,000 and $30,000. FTX collapsed. Celsius imploded. Congress held hearings. Retail investors wanted nothing to do with crypto.
Perfect accumulation conditions.
The psychological mistake here: waiting for confirmation. By the time you feel confident the bottom’s in, you’ve missed most of accumulation. Another trap: panic-selling during final capitulation events, which ironically mark the actual bottom.
Markup Phase
Price breaks resistance. Higher lows form. The uptrend becomes undeniable—that’s markup beginning.
Early on, skepticism dominates. “Dead cat bounce.” “I’ll buy when it drops back down.” Many traders sit on the sidelines expecting lower prices that never come.
As markup progresses, momentum builds. Media starts paying attention again. People who swore off crypto start researching how to buy. FOMO gradually replaces fear.
The halving usually happens during early-to-mid markup. Afterward, price appreciation often accelerates dramatically. Those 12-18 months post-halving have historically produced the steepest gains.
This phase lasts roughly 18-24 months. Prices can double, triple, or 10x. Sharp corrections happen—brutal 20-40% drops that liquidate over-leveraged traders—but the overall trend keeps pointing up.
Psychology shifts from skepticism early on, through optimism mid-phase, to full euphoria near the top. Early buyers feel vindicated. Late buyers chase performance, often entering at increasingly dangerous levels.
Classic mistakes: selling way too early (exiting after a 2x when 10x was possible), or increasing position size as prices rise (buying more at $60,000 than you bought at $20,000).
Distribution Phase
This phase tricks people. Prices might still be climbing, but smart money is exiting to retail money entering.
Momentum slows even as prices hit new highs. Volume stays elevated but represents turnover—long-term holders cashing out to newcomers buying their first Bitcoin.
Distribution is brutal to identify real-time. Prices often reach all-time highs here. Sentiment is maximum bullish. Mainstream media runs wild predictions. Your Uber driver asks about crypto. Your aunt asks about crypto. Everyone’s suddenly an expert.
This typically lasts 2-4 months, though sometimes longer. Price forms a top—sharp peaks, rounded tops, double tops. Volatility spikes. Sudden 15% drops followed by sharp recoveries become common.
Late 2021 showed textbook distribution. Bitcoin tagged $69,000 in November but couldn’t break higher despite multiple attempts. On-chain metrics revealed long-term holders were distributing to new market entrants. Exchange inflows spiked.
Behavior turns purely speculative. People buy because prices are rising, period. Leverage usage explodes. Altcoins pump on vapor. Obvious scams raise millions. Experience goes out the window.
The big mistake: confusing distribution for a continuation pattern. Traders expect “one more leg up” and add exposure at precisely the worst moment.
Markdown Phase
Welcome to the bear market. Prices crater—often 50-70% within months. Panic selling accelerates declines. Leverage liquidations create cascading drops as exchanges force-close positions.
This phase runs 12-18 months, though the worst damage typically happens in the first 6-9 months. Prices eventually stabilize at levels that seem impossibly low to anyone who bought near the top.
Volume decreases as markdown continues. After initial panic subsides, apathy takes over. Investors who held through the decline refuse to sell at losses. Prices drift lower on thin volume.
2022’s markdown took Bitcoin from $69,000 to $15,500—a 77% haircut. Ethereum dropped over 80%. Altcoins? Many lost 90%+ of their value. Companies went bankrupt. Exchanges imploded. Politicians held crypto hearings.
Psychology moves through predictable stages: denial (“just a healthy correction”), anger (“it’s manipulated by whales”), depression (“it’s never recovering”).
Capitulation—when even die-hard holders finally give up—often marks the actual bottom.
Mistakes during markdown: buying too early in the decline (“catching falling knives”), averaging down without keeping cash for the real bottom, panic-selling after the worst drops when recovery is actually near.
Identifying Bitcoin Cycle Bottom Indicators
You can’t time exact bottoms. Anyone claiming otherwise is selling something. But certain metrics have historically flagged attractive entry zones.
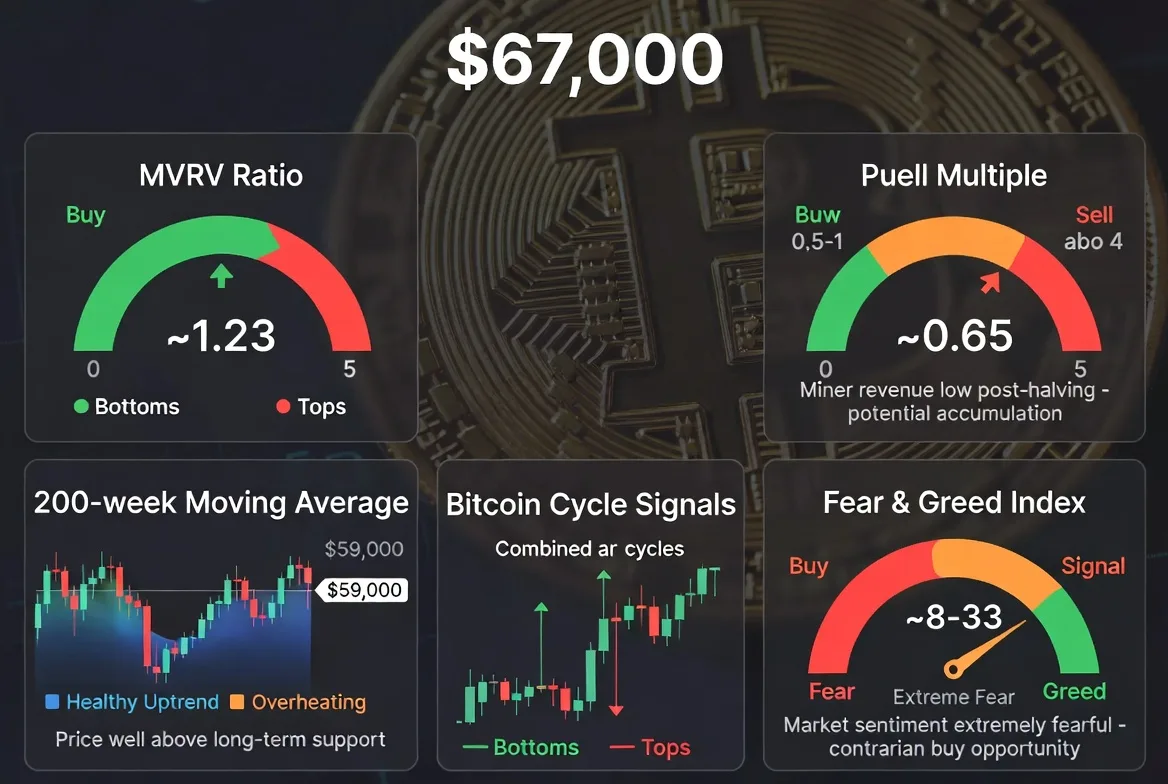
MVRV ratio compares Bitcoin’s market cap against its realized cap (value of all coins at their last-moved price). When MVRV drops below 1.0, Bitcoin trades below the average acquisition price of all holders. That’s happened at every major bottom. During 2022, MVRV hit approximately 0.8—a screaming buy signal in hindsight.
Puell Multiple tracks miner revenue against its yearly average. When miners are earning far below normal (readings below 0.5), they’re under extreme financial stress. This pressure often coincides with bottoms as weaker miners capitulate. Late 2022 showed exactly this pattern.
The 200-week moving average has never been permanently breached in Bitcoin’s history. Touches or brief dips below this level have marked exceptional buying opportunities. Bitcoin kissed this level during 2022.
Sentiment provides contrarian signals. The Crypto Fear and Greed Index showing “extreme fear” for extended periods has aligned with major bottoms. Google Trends data for “Bitcoin” dropping to multi-year lows also suggests capitulation.
Exchange netflows reveal accumulation behavior. When large Bitcoin amounts leave exchanges (moving to cold storage), holders are accumulating for the long term rather than preparing to sell. This pattern emerged consistently throughout 2023.
Hash ribbons—based on mining hash rate moving averages—signal miner capitulation when short-term hash rate crosses below long-term. The subsequent recovery cross has historically marked solid entry points.
No single indicator works perfectly. The strongest signals come from confluence: multiple metrics simultaneously flashing the same message. The 2022 bottom showed MVRV below 1.0, Puell Multiple in distress territory, extreme fear, Bitcoin near the 200-week MA, and accumulation patterns—all at once.
Market Cycle Psychology in Crypto
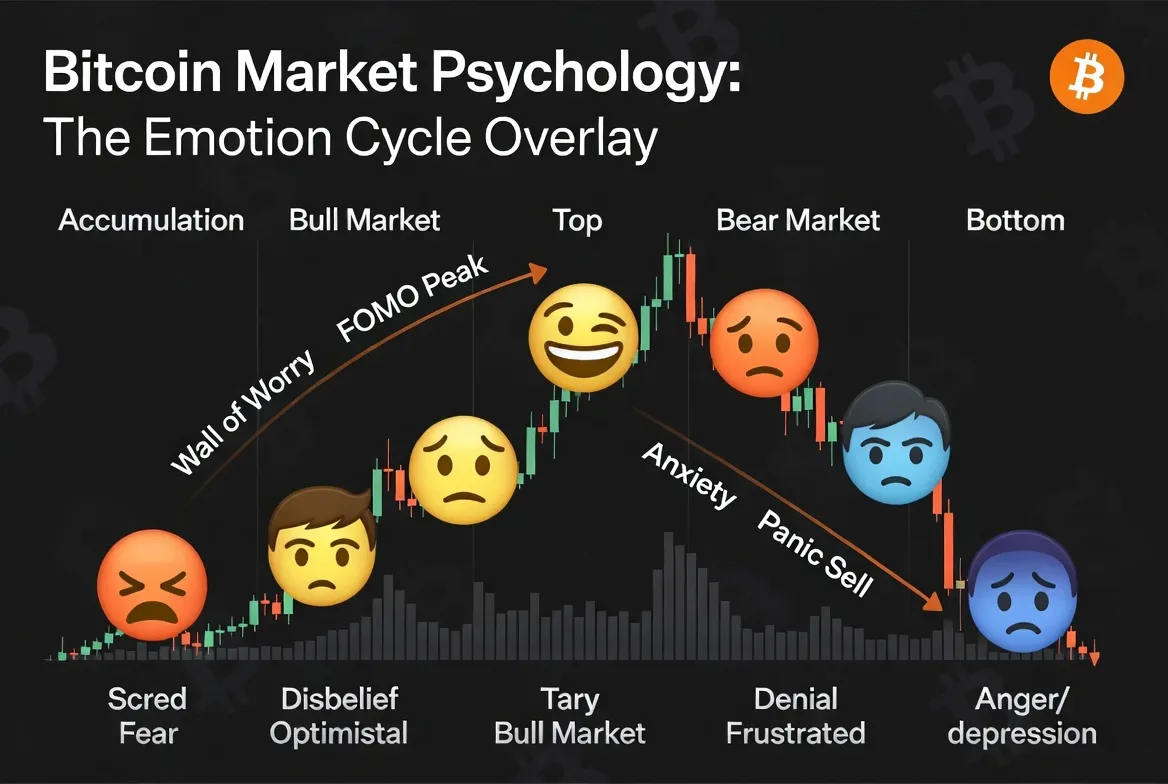
Emotions drive markets more than fundamentals. Understanding the psychological progression helps you recognize where we are in the cycle—and avoid the crowd’s mistakes.
Accumulation runs on fear. Investors who held through the crash feel burned. New buyers fear catching a falling knife. This widespread fear creates opportunity—assets are cheap precisely because most people are too scared to buy.
Early markup brings disbelief. Prices are rising but many expect a trap. “Dead cat bounce” gets repeated endlessly. Investors who sold near the bottom rationalize their decision: “I’ll buy back lower.” This disbelief keeps early markup relatively orderly.
Mid-markup brings optimism. The trend becomes undeniable. Media coverage turns positive. People who sat on the sidelines start researching entry points. Those already positioned feel validated—they were right to hold.
Late markup delivers euphoria. Everyone’s making money. Portfolios hit all-time highs. Risk feels non-existent. Social media explodes with gain posts. Dinner parties revolve around crypto talk. This euphoria marks dangerous territory.
Distribution runs on anxiety masked as excitement. Prices are elevated but volatile. Sharp drops cause concern, but rebounds restore confidence. Experienced investors feel uncomfortable despite positive price action. Newer investors remain convinced the party continues.
Early markdown brings denial. “Just a healthy correction.” “Buy the dip.” Investors expect quick recovery because that’s what happened throughout the bull market. Many add to positions here.
Deeper markdown brings anger. “Market manipulation!” “Whales are controlling everything!” Blame shifts outward—to institutions, to Tether, to regulators, to anyone except the investor’s own decisions.
Late markdown brings depression and capitulation. Investors give up. “Crypto was a scam all along.” Those who held through 80% losses finally sell, often near the actual bottom. This capitulation sets up the next accumulation phase.
The best times to buy are when you feel like throwing up. The worst times are when you feel like a genius. The market is designed to extract money from the impatient and give it to the patient.
Willy Woo
Contrarian investing means acting opposite the crowd. When fear peaks, buy. When euphoria peaks, sell. This is psychologically brutal—it requires acting when every instinct screams to do the opposite.
The Fear and Greed Index quantifies sentiment from 0-100. Readings below 20 (extreme fear) have marked major buying opportunities historically. Readings above 80 (extreme greed) have preceded significant corrections.
Crypto Market Seasonality Patterns
Beyond the four-year cycle, Bitcoin shows recurring intra-year patterns worth noting.
January has historically been strong, averaging positive returns. This “January effect” might relate to new capital entering after year-end tax planning and bonus season.
February and March show mixed results—often consolidating January’s gains rather than extending them dramatically.
April has been historically strong, possibly connected to US tax refund season providing new investment capital.
May through September typically represents the weakest stretch—the “summer doldrums.” Trading volume decreases as participants vacation. “Sell in May and go away” has shown some validity in crypto markets, though it’s not reliable enough to base strategy on.
October often marks a turning point, showing historically strong performance. November and December have also averaged above-normal returns, particularly during bull market years.
Important caveat: these patterns aren’t guarantees. 2022’s bear market saw losses throughout most months regardless of historical seasonality. Seasonality works best as a secondary consideration, not primary strategy.
Intra-month patterns exist too. The first and last trading days of months show slightly elevated volatility, possibly related to options expiries and institutional rebalancing.
Weekly patterns are subtle. Weekends sometimes see lower volume and higher volatility as institutional participants are offline and retail traders dominate.
Seasonality strategies might involve slightly increasing exposure during historically strong months and reducing during weak periods. However, this only makes sense when aligned with the broader four-year cycle. Seasonal strength during markdown phases is far less reliable than during markup phases.
Does the Crypto Supercycle Theory Hold Up
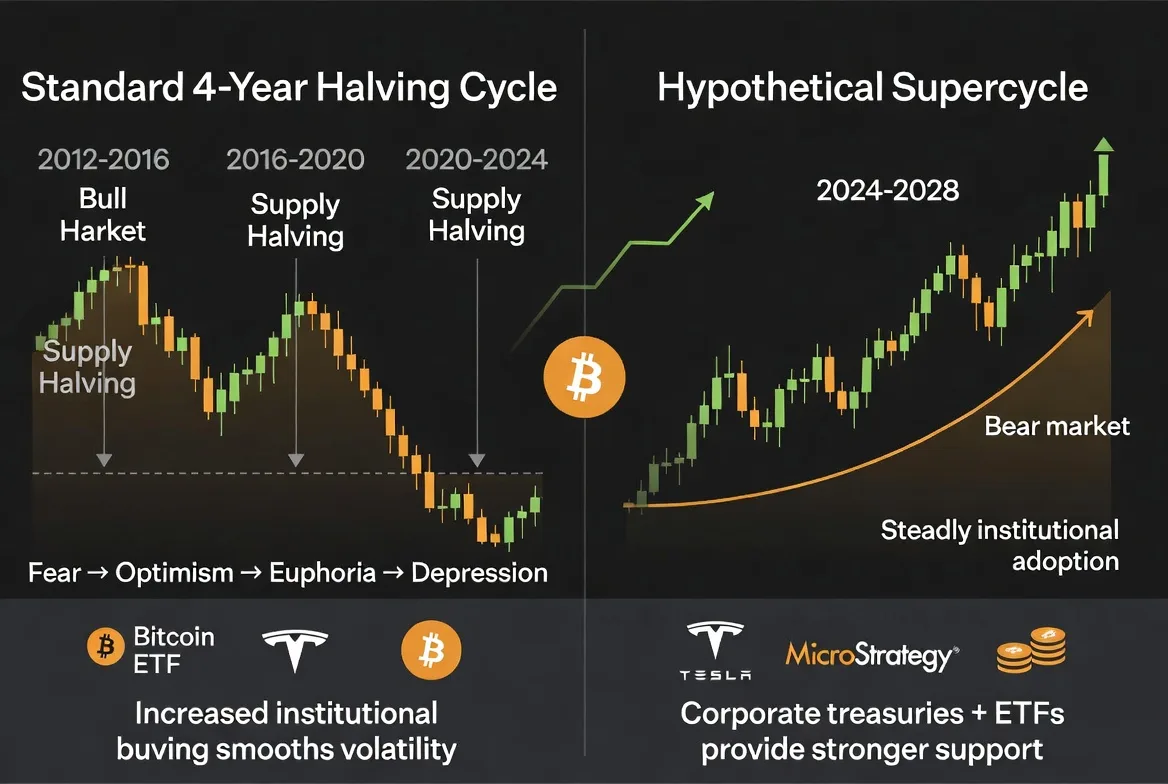
Some analysts argue Bitcoin might break from the four-year pattern, entering a prolonged bull market lasting many years without severe bear markets. They call this the “supercycle.”
Arguments favoring supercycle theory point to institutional adoption. MicroStrategy, Tesla, and other corporations added Bitcoin to treasuries. Spot Bitcoin ETFs approved in early 2024 give traditional investors easy access. This institutional capital theoretically doesn’t panic-sell during corrections like retail does.
Regulatory clarity has improved somewhat. While far from perfect, the framework is clearer than previous cycles. Reduced regulatory uncertainty should reduce volatility.
Infrastructure has matured significantly. Custody solutions, trading platforms, and financial products are more robust and professional. This should theoretically reduce extreme volatility.
The macro environment differs from past cycles too. Persistent inflation concerns and geopolitical instability create sustained demand for Bitcoin as a store of value, supporters argue.
Counterarguments are substantial though.
Every cycle has had narratives explaining why “this time is different.” 2017’s narrative was mainstream adoption and Lightning Network. 2021’s narrative was institutional adoption and inflation hedging. Yet traditional cycles continued.
Market dynamics don’t change. Regardless of who holds Bitcoin, human psychology still drives markets. Greed and fear don’t vanish because Goldman Sachs is involved. Actually, institutions can amplify moves—their risk management systems trigger forced selling during drawdowns.
The halving mechanism still exists. Supply shocks still occur every four years. Until Bitcoin’s code changes (requiring overwhelming consensus), this fundamental cycle driver persists.
Evidence through 2026 suggests evolution, not revolution. Bitcoin hasn’t reached the exponential gains some supercycle advocates predicted. The 2024 halving was followed by appreciation consistent with historical patterns, not a paradigm shift.
The most realistic outcome: cycles become less extreme rather than disappearing. Smaller percentage gains in bull markets. Shallower corrections in bear markets. Institutional participation and growing market cap naturally compress volatility ranges. But the basic cycle structure—driven by halvings and human psychology—likely persists in modified form.
Crypto Cycle Phases Comparison
| Phase | Typical Duration | Price Behavior | Volume Characteristics | Sentiment Indicators | Recommended Investor Actions |
|---|---|---|---|---|---|
| Accumulation | 12-18 months | Sideways grinding or slight upward drift; 70-85% below previous peak | Low and declining; minimal interest | Extreme fear, apathy, capitulation; media declares Bitcoin dead | Build positions gradually; dollar-cost average; ignore short-term noise; focus on fundamentals |
| Markup | 18-24 months | Strong upward trend; consistent higher highs and higher lows | Steadily increasing; expanding participation | Skepticism transitioning to optimism then euphoria; FOMO develops | Hold positions; consider taking partial profits at predetermined targets; avoid excessive leverage |
| Distribution | 2-4 months | Choppy volatility; new all-time highs but with increasing difficulty | Elevated but representing turnover from smart money to retail | Extreme greed, mania, widespread FOMO; everyone’s suddenly an expert | Reduce exposure systematically; lock in profits; prepare mentally for reversal |
| Markdown | 12-18 months | Sharp initial decline then continued grinding lower | Initially high from panic, then declining into apathy | Denial shifting to anger then depression; capitulation at bottom | Preserve capital; wait patiently for bottom confirmation signals; resist catching falling knives |
FAQs
Pretty accurate regarding the general structure, but don’t treat it like a precise timer. All three previous cycles followed the halving-to-peak-to-bottom pattern, though timing varied by several months each time. Percentage gains have decreased with each cycle—a natural result of growing market capitalization. External factors like regulation, macroeconomic conditions, and technology developments create variations within the framework. Use it as a general roadmap, not a GPS with turn-by-turn directions.
The next halving should occur around 2028—approximately four years after April 2024’s halving. If historical patterns continue, the cycle peak following 2024’s halving would likely arrive sometime in late 2025 or throughout 2026. That’s the typical 12-18 month post-halving window. However, exact timing remains unpredictable. Market conditions, regulatory changes, and macro factors all influence timing. Multiple indicators provide better signals than calendar dates alone.
Yes and no. Altcoins generally follow Bitcoin’s directional trend but with amplified volatility and timing offsets. During Bitcoin bull markets, altcoins typically outperform during later stages after Bitcoin’s momentum slows. During bear markets, altcoins usually decline more severely—often losing 90%+ while Bitcoin drops 70-80%. Some altcoins have unique catalysts like technological upgrades or regulatory developments that create independent price action. However, sustained altcoin rallies rarely happen during Bitcoin bear markets. Bitcoin leads, altcoins follow with modifications.
Based on past cycles: accumulation runs 12-18 months, markup lasts 18-24 months, distribution is brief at 2-4 months, and markdown takes 12-18 months. These are rough estimates, not precise timeframes. Distribution is shortest but hardest to identify real-time because prices often make new highs during this phase. Combined bear market (accumulation plus markdown) usually lasts 12-24 months total. Bull market (markup) typically runs 18-24 months. The complete cycle takes approximately four years, syncing with halving intervals.
Multiple confirming signals work better than any single metric. Look for: MVRV ratio dropping below 1.0, Puell Multiple in lower bands indicating miner stress, price touching or briefly breaking the 200-week moving average, extreme fear dominating sentiment indicators for weeks or months, and on-chain data showing accumulation by long-term holders. When several of these flash simultaneously, you’re likely in or near the bottom zone. Time also matters—bottoms typically form 12-18 months after cycle peaks. Bottoms are only obvious looking backward, but confluence of these signals has historically marked attractive entry zones.
It’s evolving rather than disappearing. Institutional participation, developing regulations, and macroeconomic factors add complexity that didn’t exist in Bitcoin’s early years. Percentage gains have shrunk with each cycle as market capitalization grows—basic math makes 10x gains progressively harder as the base grows. However, the fundamental structure remains: halving-driven supply shocks create conditions for appreciation. The cycle may become less extreme—smaller peaks, shallower troughs, longer phases—but likely persists in modified form as long as the halving mechanism exists in Bitcoin’s code. It’s not becoming unpredictable so much as maturing.
The crypto four-year cycle isn’t mysticism—it’s pattern recognition based on Bitcoin’s programmed supply reductions. Every 210,000 blocks, mining rewards halve, creating supply shocks that have historically preceded major price rallies. This cycle has repeated three times with remarkable consistency despite changing market conditions.
Each cycle progresses through four phases: accumulation when fear dominates, markup when prices rally, distribution when euphoria peaks, and markdown when reality returns. These phases are driven as much by mass psychology as economic mechanics. Understanding where we currently stand helps inform better decisions.
Bottom indicators like MVRV ratio, Puell Multiple, and extreme fear readings signal attractive accumulation zones—though they’re only obvious in hindsight. Understanding market psychology helps prevent emotional mistakes: buying during euphoria when you should be selling, or selling during capitulation when you should be buying.
The cycle isn’t a crystal ball. Timing varies between cycles. External factors—regulations, macro conditions, technological developments—matter enormously. The supercycle theory suggests institutions might break traditional patterns, and while the cycle may evolve, the fundamental drivers likely remain.
Success requires patience, discipline, and emotional control. The best opportunities emerge when fear is highest and conviction is hardest. The worst mistakes happen when greed peaks and caution vanishes. The cycle rewards contrarian thinking and punishes herd behavior.
Whether you’re trading or holding, understanding this cyclical framework provides context for whatever market conditions emerge. It’s not a strategy—it’s a map. Your navigation skills determine your results. As 2026 unfolds post-2024 halving, watching how this cycle develops compared to previous ones will teach valuable lessons either way.